
 408-643-0150
 647.954.5202


Continue reading "Content Dashboard KPIs for Lead Generation"
Content Dashboard KPIs for Lead Generation
To generate more leads with content, focus on measurable KPIs across the sales funnel. A content performance dashboard helps track which assets drive the most value, from awareness to conversion. Key metrics include:
- Top of Funnel (TOFU): Organic sessions, new users, newsletter signups.
- Middle of Funnel (MOFU): MQLs, Lead-to-MQL Conversion Rate, email click-through rate.
- Bottom of Funnel (BOFU): SQLs, pipeline value, Customer Acquisition Cost (CAC).
Align KPIs with funnel stages, track conversions, and ensure metrics like speed-to-lead and cost per lead (CPL) are optimized. Use attribution models (first-touch, last-touch, multi-touch) for accurate tracking. Prioritize actionable insights and consistent data governance to connect content efforts directly to revenue outcomes.
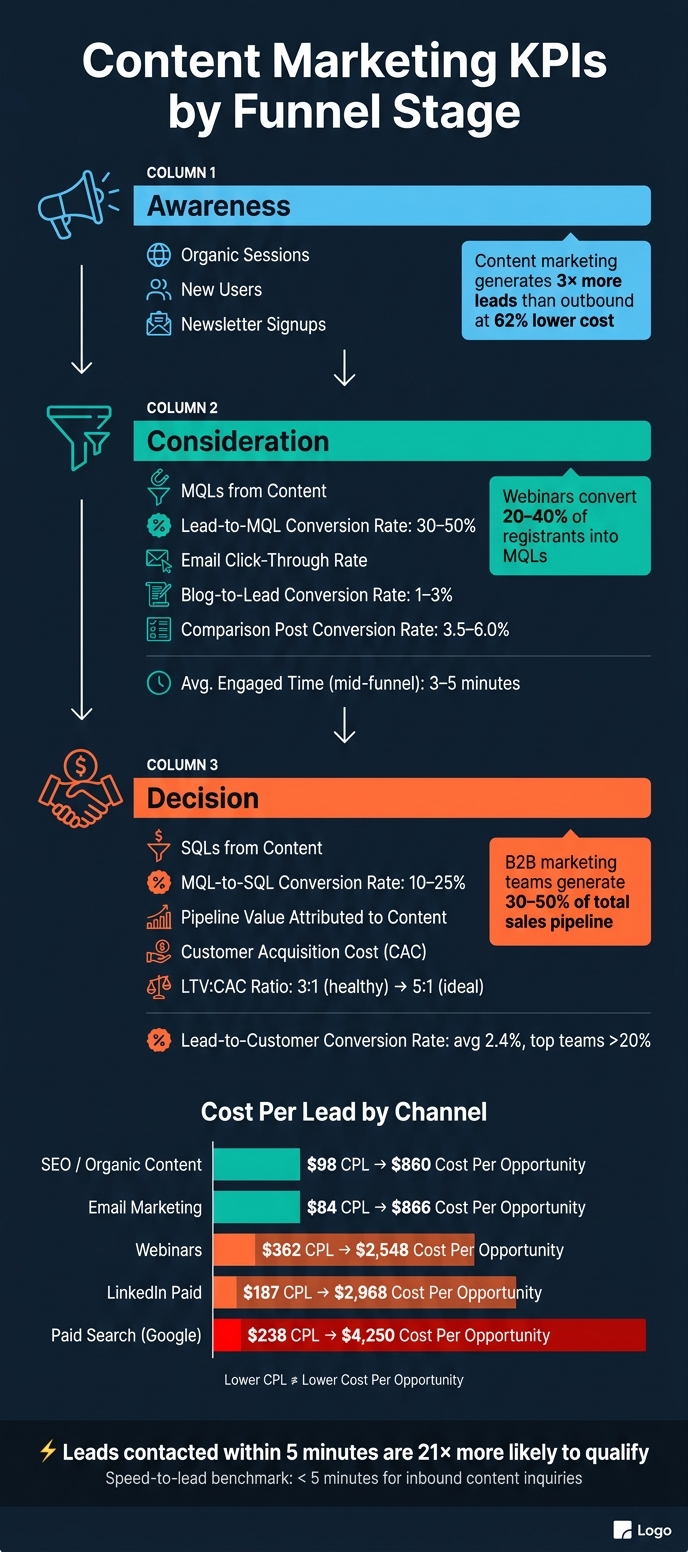
Content Marketing KPIs by Funnel Stage: Benchmarks & Metrics
How to create HubSpot KPI tracking reports in 2025
sbb-itb-0bbf42a
Core Lead Generation Outcome KPIs
These metrics are essential for connecting your content efforts to tangible business outcomes, such as qualified leads and revenue. Without them, it’s impossible to measure content ROI effectively. By aligning these KPIs with your funnel stages, you can clearly see how content impacts each step of the buyer’s journey.
Marketing Qualified Leads (MQLs) from Content
An MQL is a lead that meets your target criteria based on factors such as company size, industry, and behaviors (e.g., downloading a whitepaper or visiting a pricing page). The focus here should be on quality, not just quantity.
“A blog post with 10,000 views and zero inbound leads is not a win. A blog post with 200 views and three demo requests is.” – Emmett Miller, Co-Founder, Miniloop
Track MQLs by individual content pieces or topic clusters to identify which formats – like webinars, ebooks, or templates – are driving results. For instance, webinars often convert 20–40% of registrants into MQLs. A solid Lead-to-MQL conversion rate typically ranges from 30% to 50%. Plus, content marketing generates three times as many leads as outbound methods while costing 62% less.
Sales Qualified Leads (SQLs) from Content
SQLs are MQLs that have been vetted by the sales team and deemed to have real potential based on factors like budget, use case, and fit. The MQL-to-SQL conversion rate is a key indicator of content quality – if sales frequently rejects content-sourced leads, it may mean your content is attracting the wrong audience. For B2B teams, a healthy benchmark for this conversion rate is between 10% and 25%.
“Qualified lead volume – the count of leads that meet an agreed minimum qualification – is the core indicator of lead-generation success.” – Jamie Pagan, Director of Demand, Leadfeeder
Accurate tracking of SQLs requires alignment between sales and marketing on what defines a qualified lead, which should be clearly documented in your CRM. Strong B2B marketing teams typically generate 30–50% of the total sales pipeline, providing a solid benchmark for evaluating your content’s contribution.
Pipeline Value and Revenue Attributed to Content
This is where content KPIs directly tie into business results. You can measure this in two ways: sourced revenue, where content was the initial touchpoint, and influenced revenue, where content played a role at some point in the buyer’s journey. Both metrics answer different but equally important questions.
The formula for content ROI is simple:
Content ROI = (Revenue from Content-Sourced Deals ÷ Total Content Production Cost) × 100.
For accurate attribution, ensure every content asset is linked to CRM campaigns with consistent UTM tracking. Without this, deals risk being misattributed to “Direct” traffic, underestimating content’s true impact.
| Attribution Model | Best Use Case |
|---|---|
| First-Touch | Identifies content that drives initial awareness |
| Last-Touch | Highlights content that triggers demo requests or inquiries |
| Multi-Touch | Maps the full content journey throughout a deal |
“The most important thing is choosing between ‘sourced’ (marketing started it) and ‘influenced’ (marketing touched it) attribution and using that definition consistently across quarters.” – Jamie Pagan, Director of Demand, Leadfeeder
Consistency is key when selecting an attribution model. Switching models mid-quarter can disrupt trend analysis and make it difficult to refine future strategies. By sticking to one approach, you’ll gain actionable insights to optimize your campaigns moving forward.
Content Engagement and Mid-Funnel KPIs
Mid-funnel metrics reveal how prospects interact with your content before they take the plunge and convert. These indicators help you pinpoint which pieces quietly drive your pipeline forward and which ones fail to keep readers engaged long enough to act.
Content-Sourced Lead Conversion Rate
This metric tracks the percentage of content visitors who take a lead-capture action – whether it’s downloading a whitepaper, signing up for a webinar, or requesting a demo. For B2B SaaS companies, blog-to-lead conversion rates typically hover between 1–3%. If your rate is below 1%, chances are your call-to-action (CTA) needs some work.
“A blog post generating 10,000 monthly visits and zero leads isn’t an asset – it’s an expense.” – The Seo Engine
To understand what’s working, compare conversion rates across different content types. For instance, comparison posts often outperform other posts, converting at rates between 3.5–6.0% because readers are already in solution-evaluation mode. Companies that fine-tune their content funnels have seen conversion rates increase by as much as 60%.
Once you’ve assessed content performance, take a closer look at landing page optimization to see how effectively they’re converting interest into leads.
Form Fill Rate on Content Landing Pages
The form fill rate measures how well a landing page turns visitors into leads. Even high-traffic pages can fall short if the form is too long, the CTA is unclear, or the value proposition doesn’t resonate with visitors.
Certain content types – like buyer’s guides, checklists, and decision frameworks – tend to attract higher-quality leads. Adding elements like client logos, brief testimonials, or snippets from case studies directly to the landing page can help build trust and reduce hesitation. On the technical side, make sure every form submission triggers a GA4 conversion event with consistent UTM parameters. This allows you to link each submission back to its source and to the content that drove it.
Engagement Metrics for Key Content Assets
Beyond lead conversion and form metrics, engagement depth provides another layer of insight into content performance. Metrics like engaged time and scroll depth give a clearer picture of how much value readers are extracting. For example, a reader who spends 4 minutes on a page and scrolls 75% of the way through is far more engaged than someone who bounces in 10 seconds.
In GA4, you can set up custom scroll-depth events at the 25%, 50%, 75%, and 100% marks. Articles in which 60% or more of readers reach the 75% scroll mark are typically high performers. As for engagement time, mid-funnel content usually sees benchmarks between 3 to 5 minutes. For blog posts, spending over 2 minutes and 30 seconds often correlates with better downstream conversions.
Repeat visits to high-intent pages signal that a prospect is seriously evaluating their options. For example, someone who interacts with an ROI calculator or a pricing comparison page twice in one week is likely deep in the decision-making process.
“Someone reading your ‘us vs. them’ pricing comparison twice in one week is not just browsing.” – Avinash Saurabh, Author
Here’s a quick reference table to help you set realistic engagement benchmarks for various content types:
| Content Type | Avg. Engagement Time | Lead Conversion Rate | Intent Level |
|---|---|---|---|
| How-to Guides | 3:45 | 1.2–2.5% | Informational |
| Comparison Posts | 2:30 | 3.5–6.0% | Commercial |
| Industry Research | 4:15 | 0.8–1.5% | Authority Building |
| Topic Cluster Pillars | 5:30 | 1.8–3.2% | High/Educational |
Source: [10]
Lead Quality and Cost Efficiency KPIs
When it comes to content marketing, it’s not just about generating leads – it’s about ensuring those leads are worth the investment. By focusing on cost-efficiency metrics, you can ensure that every dollar spent on content translates into high-quality leads that drive results.
Cost Per Lead (CPL) for Content Campaigns
To calculate CPL, divide your total content spend by the number of leads your campaign generates. This calculation should include all associated costs: production, software, agency fees, paid distribution, and even a proportional share of team salaries. Skipping production costs can underestimate CPL by as much as 40%–60%.
A more insightful metric is Cost Per Qualified Lead (CPQL), which measures your spend against leads that align with your ideal customer profile (ICP). Relying solely on raw CPL can be misleading – lowering qualification standards might inflate lead numbers but could also drive up costs further down the funnel.
“The cheapest lead is almost never the most profitable one.” – Swati Patil, Revnew
Take a look at the table below to see why CPQL provides a clearer picture than raw CPL. For instance, while SEO and organic content may have a lower CPL, their true value shines in the cost per opportunity:
| Channel | Median CPL | Lead-to-Opportunity Rate | Cost Per Opportunity |
|---|---|---|---|
| SEO / Organic Content | $98 | 11.4% | $860 |
| Email Marketing (House) | $84 | 9.7% | $866 |
| Webinars | $362 | 14.2% | $2,548 |
| LinkedIn (Paid) | $187 | 6.3% | $2,968 |
| Paid Search (Google) | $238 | 5.6% | $4,250 |
Source: [20]
For example, while a LinkedIn lead costing $150 might seem expensive, it’s far more efficient than a $25 social lead with a conversion rate of just 0.5%. Always prioritize cost per closed deal over cost per lead to get a clearer picture of channel efficiency.
Customer Acquisition Cost (CAC) for Content-Driven Deals
CAC is calculated by dividing total sales and marketing expenses by the number of new customers acquired in a specific period. For content-driven strategies, the LTV:CAC ratio is a key benchmark. A healthy ratio starts at 3:1, but exceeding 5:1 is considered ideal.
One major advantage of organic content is its long-term value. Unlike paid channels, where costs reset as soon as you stop spending, strategies like SEO continue to deliver returns over time. Most programs break even within 7 to 9 months, while private SaaS companies report a median gross profit CAC payback period of around 23 months.
Lead-to-Customer Conversion Rate for Content-Sourced Leads
This metric tracks the percentage of content-sourced leads that turn into paying customers. The average B2B lead-to-customer conversion rate is 2.4%, but top-performing teams often achieve rates exceeding 20%. If your conversion rate is below 10%, it’s a signal that adjustments are needed.
“Lead volume is not lead generation ROI. The two aren’t just different, they’re often inversely related.” – Swati Patil, Revnew
Improving this rate involves moving beyond last-click attribution. This model often undervalues early-stage content by 15%–30% in multi-touch B2B journeys. Instead, consider linear or W-shaped attribution models that spread credit across the entire buyer journey. Pair this with behavioral lead scoring – assigning higher scores to actions like visiting pricing pages or using ROI calculators – and you could see lead-to-MQL conversion rates of 39–40%, compared to the industry average of 31%.
Operational KPIs and Dashboard Best Practices
Operational KPIs build on lead and engagement metrics, focusing on timely responses and smooth funnel management. These metrics connect content performance with actionable improvements, making it easier to qualify and convert leads effectively.
Speed to Lead for Content Inquiries
Quick follow-up is essential when responding to content inquiries. Did you know that leads contacted within 5 minutes are 21 times more likely to qualify than those reached after 30 minutes? That’s why tracking this metric is crucial, especially for content-sourced inquiries. For instance, letting a whitepaper download sit unaddressed for two days is a missed opportunity.
The table below highlights time benchmarks by funnel stage to help you stay on top of this metric:
| Funnel Stage | Time-Based Metric | Benchmark |
|---|---|---|
| Inbound Lead | Speed-to-Lead | < 5 minutes |
| MQL to SQL | Time to Accept (SLA) | < 24 hours |
| Opportunity | Sales Cycle Length | 90–180 days |
| Entire Funnel | Pipeline Velocity | Revenue generated per day |
Average Time in Funnel Stages
Understanding how long leads linger at each funnel stage – MQL, SQL, or open opportunity – is equally important. Known as dwell time, this metric can pinpoint where your funnel is breaking down. For example, a typical B2B funnel loses 75% of MQLs before they progress to SQLs.
To prevent drop-offs, set specific thresholds. If a lead remains in SQL status for more than 7 days without a scheduled meeting, trigger an alert. This turns your dashboard from a passive tool into an active one that drives action.
Another valuable metric to include is pipeline velocity, which combines opportunity count, average deal size, win rate, and sales cycle length. This single figure shows how quickly revenue moves through your funnel.
Dashboard Design and Data Governance
A good dashboard isn’t about cramming in every metric – it’s about showing the right metrics to the right people.
“The dashboard problem is not which metrics exist, it is which ones actually belong in the room with whoever is reading the report.” – Niklas Kreck, Founder, Leadanic
To make dashboards more effective, segment them into three tiers:
- Executive dashboards: Focus on monthly revenue, CAC, and pipeline value.
- Team dashboards: Highlight weekly MQL/SQL, conversion rates, and CPL.
- Channel dashboards: Cover daily CTR, CPC, and engagement metrics.
Keep executive dashboards to 5–7 metrics and operational dashboards to 10–12 to avoid overwhelming users with unnecessary data.
On the data governance front, many businesses face challenges: 68% haven’t fully documented their sales funnel definitions, and 72% of marketing teams struggle with attribution due to unreliable data. Two simple fixes can address this:
- Use consistent UTM tagging across all content links.
- Maintain documented, version-controlled definitions for MQL and SQL.
As Improvado aptly puts it:
“A dashboard that’s ‘close enough’ will be ignored. Stakeholders need to trust the numbers completely, or they’ll default back to their old spreadsheets.” – Improvado
To keep dashboards relevant, audit them quarterly. Remove tiles that don’t drive action and update definitions to align with changes in your ICP. Automating weekly email summaries can also keep stakeholders updated.
Conclusion and Next Steps
Tracking KPIs such as MQLs, SQLs, speed-to-lead, and pipeline velocity transforms your content dashboard into a tool that directly impacts revenue. With 48% of B2B buyers now using AI tools to research vendors before visiting a company website [28], dashboards that focus solely on traditional organic traffic are missing out on key opportunities. This shift highlights the importance of aligning your dashboard with the changing ways buyers engage online.
The most effective dashboards connect content activities to revenue metrics at every stage of the buyer journey. For example, data shows that AI-referred traffic converts at 4.4× the rate of traditional organic search traffic.
“Traffic without conversion is a cost without return. Every page should serve as a lead generation asset.” – WSI Smart Web Marketing
For B2B leaders looking to implement these KPIs, WSI Smart Web Marketing provides custom dashboard solutions. These dashboards pull data from SEO, paid ads, social media, website performance, and AI visibility reporting into a single, real-time view. They even track brand mentions across tools like ChatGPT, Perplexity, and Google AI Overviews.
“We build systems around what matters most to each client. Whether it’s lead generation, online sales, or brand awareness, we measure what moves the needle for your business.” – Howard Walker, WSI Smart Web Marketing
To make the most of these insights, the next step is straightforward: start with a search visibility audit to understand your current position and align KPIs with each stage of the buyer journey. From there, set up monthly review cycles to refine your strategy based on what delivers the best results.
FAQs
Which KPIs should I track first for content lead generation?
To improve lead generation, it’s essential to track key performance indicators (KPIs) that directly impact your goals – like lead volume, conversion rates, and revenue-generating channels. Here’s where to start:
- Lead Volume vs. Targets: Measure how closely your lead volume aligns with your goals.
- Cost Per Lead by Channel: Understand which channels deliver leads most efficiently.
- MQL-to-SQL Conversions: Track how effectively marketing-qualified leads (MQLs) are turning into sales-qualified leads (SQLs).
When it comes to content performance, focus on metrics that connect your efforts to business results. For example:
- Organic Traffic Growth: Pay attention to traffic in high-intent categories – these are the visitors most likely to convert.
- Content-Driven Leads: Measure how much of your lead volume is coming from your content.
- Assisted Conversions: Track how your content contributes to conversions, even if it’s not the final touchpoint.
Avoid getting distracted by vanity metrics like pageviews. Instead, concentrate on KPIs that reflect meaningful outcomes, such as pipeline value and revenue. This approach ensures your content strategy is aligned with real business growth.
How do I attribute pipeline and revenue to specific content pieces?
To properly link pipeline and revenue to specific content, it’s crucial to integrate your web analytics with your CRM through a unified tracking system.
Ensure you’re using consistent UTM parameters and establishing a clear taxonomy to organize and track your assets effectively. Set up auto-contact and deal associations in your CRM to streamline data integration. Additionally, implement multi-touch attribution models – like W-shaped or time-decay – to capture a more accurate picture of how your content contributes to both sourced and influenced pipeline. This approach will reflect precise content-driven results in your revenue reports.
What’s the fastest way to improve content-to-lead conversion rates?
The fastest way to improve conversion rates is to match your content with what users are looking for and where they are in their buying journey. Start by mapping your content to see whether it informs, reassures, or motivates action. Then, tweak it to align with user intent. Shift away from simply listing features and focus on telling stories that solve problems. Add relevant calls to action and offer valuable resources, such as templates or reports, to convert readers into qualified leads.
About the Author
The Best Digital Marketing Insight and Advice
The WSI Digital Marketing Blog is your go-to-place to get tips, tricks and best practices on all things digital
marketing related. Check out our latest posts.
We are committed to protecting your privacy. For more info, please review our Privacy and Cookie Policies. You may unsubscribe at any time.
Don't stop the learning now!

How to Build a Predictable B2B Lead Generation System
Creating a predictable B2B lead generation system is a crucial goal for modern organizations seeking sustainable growth. In today’s competitive environment, many businesses struggle to generate consistent leads, find effective ways to nurture them, and convert them into measurable revenue. Bill Rice, a seasoned entrepreneur and lead generation expert, breaks down a comprehensive framework for …
Continue reading “How to Build a Predictable B2B Lead Generation System”
READ MORE
What Lead Gen Tactics Should B2B Companies Follow in 2023?
Lead generation is a critical driver in your business’s growth, which is why sales and marketing teams focus so much time and resources on it. In a perfect world, you would always have high-quality leads coming in, however, getting those high-value leads is easier said than done. Plenty of lead generation strategies can be followed …
Continue reading “What Lead Gen Tactics Should B2B Companies Follow in 2023?”
READ MORE
How to Get More Leads from Your Landing Pages
Summary: When the website experience (on your landing page), your visitors intent and your company goals are all aligned, the magic happens. Read insights from a conversion rate optimization expert on how to create effective landing pages for your site. We’ve seen the challenges many businesses experience including how to generate more quality leads. We …
Continue reading “How to Get More Leads from Your Landing Pages”
READ MORE