
 408-643-0150
 647.954.5202
Marketing Strategy
Customer Experience Benchmarking for B2B Firms


Continue reading "Customer Experience Benchmarking for B2B Firms"
Customer Experience Benchmarking for B2B Firms
I start B2B customer experience benchmarking with one question: Where does buying or using our service get difficult? To answer it, I choose four measures: relationship health, service quality, onboarding or adoption, and retention or revenue.
Then I follow a simple plan:
- Map the journey and buyer personas. Check where buyers, users, and decision-makers face different problems.
- Connect the data. Link feedback with CRM, support, usage, and billing records using consistent account IDs and metric definitions.
- Choose the comparison. Use past results, competitor feedback, or industry data – and compare similar customer groups.
- Set targets and assign owners. Give each fix a deadline, then check customer and business results regularly.
My rule: Compare like with like. For example, moving CSAT from 82% to 86% means a 4-percentage-point increase. That’s a clear target, but it doesn’t prove revenue will grow.
For marketing and sales leaders, benchmarking shows where messaging, sales handoffs, and service experiences help or hurt pipeline, renewals, and referrals. That makes it a growth tool, not just a customer-service report.
The goal is better decisions, not a bigger dashboard.
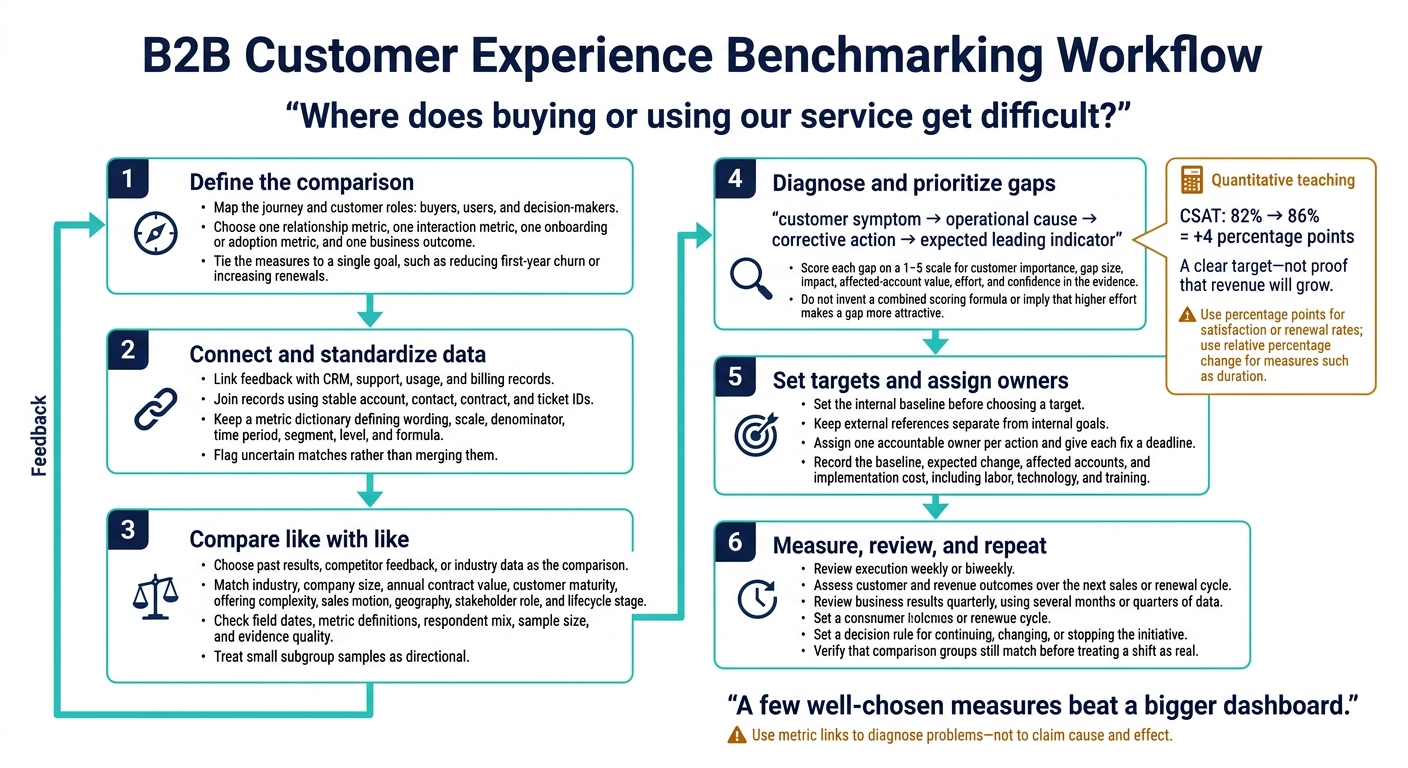
B2B Customer Experience Benchmarking Workflow
Choose Metrics and Connect Customer Data
Once you’ve set the scope, choose a small set of metrics that shows how customer experience relates to retention and revenue. Start with one relationship metric, one interaction metric, one onboarding or adoption metric, and one business outcome. Tie them to a single goal, such as reducing first-year churn or increasing renewals.
Match Metrics to Journey Stages
Build a metric dictionary that defines wording, scale, denominator, time period, segment, level, and formula. Use the definitions below as your starting point, and keep wording and sampling consistent. Before adding more measures, connect feedback to process, usage, and revenue records.
| Metric | Definition and calculation | Stage | Source | Frequency / owner | Interpretation |
|---|---|---|---|---|---|
| NPS | % promoters (9–10) − % detractors (0–6), using valid responses on a 0–10 scale; range: −100 to +100 | Relationship, renewal | Relationship survey | Quarterly or semiannually / customer success or CX | Account health and loyalty; compare only when wording and sampling stay consistent |
| CSAT | Satisfied responses ÷ valid responses × 100; define satisfied, such as 4–5 on a 5-point scale | Sales handoff, onboarding, support | Post-interaction survey | After selected interactions/service or CX | Satisfaction with a specific experience |
| Customer effort score (CES) | Mean task-effort rating; document the scale and whether higher means easier or harder | Onboarding, support | Task or ticket survey | After selected tasks/operations or service | Friction when completing a task |
| Response time | Median and 90th-percentile time from request to first human response | Sales, support | CRM or ticketing system | Weekly or monthly / sales or service operations | First-response speed; medians and percentiles limit distortion from outliers |
| Resolution time | Median and 90th-percentile time from case creation to confirmed resolution | Support | Ticketing system | Weekly or monthly / service operations | Process efficiency; segment by issue type and severity |
| First-contact resolution | Issues resolved on first contact ÷ eligible issues × 100 | Support | Ticketing system | Weekly or monthly / support | Resolution without follow-up contacts |
| Onboarding completion | Accounts completing defined milestones ÷ accounts beginning onboarding × 100 | Onboarding | Project or customer-success system | By cohort/onboarding leader | Whether customers complete required setup |
| Time-to-value | Median days from a defined kickoff to the first meaningful customer outcome | Onboarding, adoption | Project and usage records | By cohort/customer success or product | Time from kickoff to first meaningful outcome |
| Adoption | Accounts meeting a usage threshold ÷ eligible active accounts × 100 | Usage | Product or service-usage data | Monthly/product or customer success | Whether customers use contracted capabilities |
| Account retention | Starting accounts still active at period end ÷ starting accounts × 100 | Continuing relationship | CRM or billing | Monthly, quarterly, or annually / finance or customer success | Account continuity; specify whether it is logo-based |
| Renewal rate | Renewed contracts ÷ eligible contracts due for renewal × 100 | Renewal | CRM or billing | By renewal cohort/account management | Renewal execution, separate from general retention |
| Expansion | Starting accounts that expand ÷ starting accounts × 100; separately report expansion revenue ÷ starting recurring revenue × 100 | Expansion | CRM or billing | Quarterly/revenue operations | Separates account growth from revenue growth |
| Net revenue retention | (Starting recurring revenue − churn − contraction + expansion) ÷ starting recurring revenue × 100 | Renewal, expansion | Billing and CRM | Monthly or quarterly / finance | Revenue retained and expanded from the starting customer base |
Pair speed with effectiveness. Faster responses mean less if customers still need repeat contacts. Read these metrics together to find where speed, effort, and retention tell different stories. Use those links to diagnose problems, not to claim cause and effect.
Next, match each metric to a data source that can verify it.
Choose Customer Data Sources
Use surveys to measure perceptions, process records to track behavior, and billing data to measure revenue outcomes. When signals conflict, compare distributions and medians rather than relying only on averages. Website activity and public reviews add context, but they don’t prove an account’s experience on their own.
- Surveys and customer interviews measure perceptions and explain the reasons behind scores. Watch for response bias and small, unrepresentative samples.
- Account and executive business reviews validate business priorities and outcomes, though they may reflect only your most engaged contacts.
- CRM, ticketing, and onboarding records track ownership, response and resolution times, and milestones. Check for inconsistent or incomplete data entry.
- Product or service usage data shows adoption and engagement but may miss offline use.
- Website analytics and public reviews add context on discovery and reputation, but they don’t prove an account’s experience.
- Billing and finance systems measure retention, renewal, expansion, and net revenue retention, but not what caused them.
Before comparing results, normalize the records so every metric uses the same account and time definitions.
Standardize Account-Level Data
Join records using stable account, contact, contract, and ticket IDs, and flag uncertain matches rather than merging them. Keep survey wording, timing, and scales consistent, and version every change so comparisons stay valid. Report contact-level and account-level scores separately.
Follow your access, retention, and consent rules. When samples are small, say so rather than hiding them, and add interviews and open-ended comments to fill the gaps.
sbb-itb-0bbf42a
Compare Customer Segments and Competitor Perceptions
Match Customer Groups and Check Data Quality
Once you standardize account-level data, compare only matched customer groups to assess competitor perceptions. Match industry, company size, annual contract value, customer maturity, offering complexity, sales motion, geography, stakeholder role, and lifecycle stage to define your target audience and benchmark accurately. This helps separate actual experience gaps from differences between segments.
Before comparing scores, check segment alignment, field dates, metric definitions, respondent mix, sample size, and evidence quality.
| Comparison area | Acceptable alignment | Possible bias | Corrective action |
|---|---|---|---|
| Industry, size, and contract value | Similar operating needs and service tiers | Dedicated enterprise service can distort comparisons | Separate standard accounts from accounts with dedicated service |
| Maturity, complexity, and sales motion | Similar tenure, implementation requirements, and buying process | New deployments face different friction than mature accounts | Compare equivalent cohorts and deployment types |
| Geography and respondent role | Similar service coverage, time zones, and stakeholder duties | Local response norms and role priorities affect ratings | Analyze regions and roles separately; document local differences |
| Period, questions, and sample | Comparable field dates, wording, and respondent mix | Timing and uneven participation can shift scores | Repeat matched research; label weak comparisons as directional |
Customer experience research focuses on matched samples and changes over time – not the assumption that raw scores are comparable. Treat small subgroup samples as directional, and use interviews to explain the gaps.
Compare Experiences by Buying Criteria
Use evaluation-stage criteria to compare how buyers choose providers. Ask the same importance and performance questions for each provider, and note whether ratings reflect firsthand use, a purchase evaluation, or reputation.
Combine surveys, win-loss interviews, call themes, and public commentary. Don’t score competitors based on isolated comments.
Use this matrix to collect evidence, not to rank competitors. Include the respondent count and period in every completed row. The scores below are illustrative examples, not real survey results.
Criterion Customer importance Company score Competitor perception Evidence source Confidence Priority Buying-process clarity High 3.8/5 Competitor A perceived as stronger Prospect survey and win-loss interviews Medium High Implementation expertise High 4.2/5 No reliable competitor data Customer survey and onboarding records High for company; unavailable for competitors Medium Responsiveness High 3.4/5 Competitor B perceived as faster CSAT comments and sales-call themes Medium High Ongoing value Medium 3.6/5 Perception is mixed Renewal interviews and account reviews Low to medium Medium Support resolution High 82% satisfied No comparable public evidence Support CSAT and ticket records High for company; unavailable for competitors High
Set Baselines and Improvement Targets
Set the internal baseline before choosing a target. Then use verified external references to guide decisions. Keep external values separate from internal goals, and record each source’s publication date, population, sample size, and methodology.
If you can’t verify those details, treat the figure as context – not a performance standard. Keep the next-period target separate from the longer-term goal.
Illustrative example: The figures in the table below are hypothetical. They show how to structure a baseline and target table; they are not published industry benchmarks.
Metric Internal result External reference Internal target Measurement period Source Caveat Post-support CSAT 82% 75%–85% published external range 86% by Q4 2027 Q4 2026 Support survey External range may use different industries and scales Relationship NPS 24 32 global average reported in one 2025 summary 32 by Q4 2027 Annual survey Relationship survey Population, response rate, and methodology must be verified Customer effort 5.1/7 Not comparable 5.8/7 Q4 2026 Post-resolution survey Scale direction must be confirmed First-response time 3.2 business hours Not available 2.5 business hours Q4 2026 Ticketing system Business-hours definition required
Report the gap to target only when definitions remain comparable. Use percentage points for changes in satisfaction or renewal rates, and relative percentage change for measures such as duration.
State a percentile only when you have a comparable peer distribution; a published average isn’t enough. Use the largest verified gaps to guide marketing, sales, and service actions.
Turn Benchmark Gaps Into Business Actions
Turn verified gaps into a short list of actions that can deliver the biggest impact. Score each gap on a 1–5 scale for customer importance, gap size, commercial impact, affected-account value, effort, and confidence in the evidence. Use CRM, billing, product-usage, and support systems to measure impact and track follow-up.
Find the causes using handoff records, ticket data, usage records, interviews, and retrospectives. Document the chain: customer symptom → operational cause → corrective action → expected leading indicator. High frustration doesn’t always mean high revenue risk.
Turn Benchmark Gaps Into Business Actions
Turn verified gaps into a short list of high-impact actions. Score each gap on a 1–5 scale for customer importance, gap size, commercial impact, effort, and confidence in the evidence.
Find the causes using handoff records, ticket data, usage records, interviews, and retrospectives. Document the chain: customer symptom → operational cause → corrective action → expected leading indicator. High frustration doesn’t always mean high revenue risk.
Example: How a Manufacturer Might Act on a Benchmark Gap
Consider a hypothetical manufacturer of industrial test equipment. Its post-support CSAT is steady, but renewal interviews reveal that new customers take months to see value. Onboarding records confirm the pattern: accounts sold with custom integrations take far longer to complete setup than standard accounts.
The root cause is a handoff gap. Sales commits to integration timelines that applications engineering never reviewed. The company responds on three fronts: marketing publishes an implementation guide and integration FAQ for each product line, sales adds a technical-readiness checklist to discovery, and customer success sets milestone dates at kickoff.
The team tracks onboarding completion and time-to-value as leading indicators, then tests whether renewals improve over the next renewal cycle. The benchmark did more than produce a score. It changed what marketing published, what sales promised, and how onboarding ran.
Align Marketing and Sales
When customers don’t understand the value, give them industry-specific messaging, role-specific landing pages, case studies, FAQs, implementation guides, customer evidence, and proof points. Use that evidence to shape conversion paths, too.
Sales should draw on the same evidence to improve discovery questions:
What business outcome matters? Who approves the purchase? What integrations and resources are required?
Marketing and sales should define qualification criteria together. In the handoff, document scope, timing, dependencies, and success measures. Track qualified-opportunity rate, proposal-to-close rate, sales-cycle time, content engagement by target account, and expectation-related objections.
Reduce Onboarding and Service Friction
Give each account a named implementation owner, written milestones, clear dependencies, an escalation path, and scheduled status updates. Measure the time from contract signature to kickoff, then from kickoff to first value.
Review SLA performance by ticket priority, and fix recurring causes instead of repeatedly rescuing individual accounts. Use adoption, unresolved issues, stakeholder engagement, and renewal dates to trigger account reviews, and discuss expansion only after you’ve proven value.
Assign Action Owners and Measure Results
Assign Action Owners and Measure Results
Assign one accountable owner per action, even when several functions contribute. Review execution weekly or biweekly, then assess customer and revenue outcomes over the next sales or renewal cycle.
Record the baseline, expected change, affected accounts, and implementation cost, and set a rule for continuing, changing, or stopping the initiative. Where feasible, compare affected accounts with similar ones. A higher CX score alone doesn’t prove revenue impact, so report an association unless your evaluation supports a causal claim.
Keep a simple action log covering the finding, cause, owner, fix, leading indicator, and outcome. The entries below are illustrative examples of how to structure it.
Finding 1: Customers report inconsistent implementation expectations (handoff and onboarding)
- Root cause: Sales and delivery use different scope assumptions.
- Owner and action: Sales and customer success. Add a signed success plan and a delivery-readiness checklist.
- Measures: Share of opportunities with a completed checklist and fewer scope escalations, tested against faster time-to-value, lower implementation cost, and better renewal readiness.
- Priority and timing: High. Due October 30, 2026; first review November 13, 2026.
Finding 2: Strategic accounts experience slow support resolution (service)
- Root cause: Escalation ownership and priority rules are unclear.
- Owner and action: Support and customer success. Reconfirm SLA tiers and escalation paths, and review aging tickets weekly.
- Measures: SLA adherence, median resolution time, and aged-ticket count, tested against lower cost to serve and reduced churn risk.
- Priority and timing: High. Due November 6, 2026; first review November 20, 2026.
Finding 3: Economic buyers do not understand business value (evaluation)
- Root cause: Content emphasizes features rather than outcomes.
- Owner and action: Marketing and sales. Create an industry-specific business-case page and discovery guide.
- Measures: Engagement from target accounts and qualified-opportunity rate, tested against better proposal conversion and sales efficiency.
- Priority and timing: Medium. Due November 13, 2026; first review December 4, 2026.
Conclusion: Make Benchmarking a Regular Practice
Once you standardize data, compare segments, and act on gaps, put benchmarking on a fixed schedule. Define the comparison, connect reliable data, compare like accounts, diagnose gaps, take action, and measure again. A few well-chosen measures beat a bigger dashboard.
Set Responsibilities and Review Schedules
Make benchmarking a company-wide responsibility, backed by an executive sponsor who keeps priorities aligned. Marketing and sales should agree on qualification and handoff definitions, often supported by marketing automation. Product marketing should maintain customer feedback loops, while operations and analytics should maintain data quality and reporting. Keep a metric dictionary and benchmark log.
Check process metrics as often as volume allows, and review business results quarterly. Before treating a shift as real, confirm that the comparison groups still match.
Start With a Few Metrics and Expand
Start with the four measures introduced at the beginning of this article: one relationship metric, one service or interaction metric, one onboarding or adoption metric, and one business outcome tied to retention or revenue. Set internal baselines, connect feedback to CRM and billing data, and add one layer at a time as data quality improves.
Turn CX Benchmarks Into Revenue Growth
Benchmarking pays off only when the findings change how you market, sell, and serve. Most B2B firms already hold the data they need in their CRM, support, and billing systems. What they lack is the time, structure, and cross-functional ownership to connect that data and act on it.
That is the work I do with B2B technology companies and manufacturers. As a B2B fractional CMO, I provide the marketing leadership to choose the right metrics, align marketing, sales, and customer success around shared definitions, and turn benchmark gaps into a prioritized growth plan. My analytics and reporting services connect website, CRM, and campaign data so you can see which experiences lead to qualified pipeline, and a competitive analysis shows where competitors are winning attention with the buyers you both pursue.
Not sure where your customer experience is costing you deals or renewals? Schedule a free consultation, and we will identify the few benchmarks that matter most for your business and what it will take to improve them. No sales pitch, just practical next steps from a consultant with more than two decades in the technology industry.
FAQs
How can we benchmark CX with limited customer data?
Start with the records you already have. Pull support tickets, onboarding milestones, and renewal history from your CRM and service systems, then run a short relationship survey with your most important accounts. A handful of structured customer interviews will often explain gaps that scores alone cannot.
Ask sales and support to log recurring questions, objections, and escalations in a consistent format. Use GA4 and CRM data for context on how prospects research and convert, but don’t treat website behavior as proof of an account’s experience. Combine these sources to set an internal CX baseline, then add measures as your data quality improves.
How should we weigh feedback from different account stakeholders?
Weigh feedback against each stakeholder’s priorities. Technical evaluators focus on performance, end users on ease of implementation, financial gatekeepers on ROI and total cost of ownership, and executives on strategic fit.
Agree on metric definitions across departments, track engagement at the account level in your CRM, and prioritize actions by business value and conversion potential.
How can we test whether CX improvements drive renewals?
Track renewal rates alongside CSAT and onboarding metrics for the accounts affected by a change, and compare them with similar accounts that weren’t affected. Review the results over at least one full renewal cycle before concluding that the improvement drove renewals.
About the Author
The Best Digital Marketing Insight and Advice
The WSI Digital Marketing Blog is your go-to-place to get tips, tricks and best practices on all things digital
marketing related. Check out our latest posts.
We are committed to protecting your privacy. For more info, please review our Privacy and Cookie Policies. You may unsubscribe at any time.
Don't stop the learning now!

How B2B Leaders Align Stakeholders Early
How B2B Leaders Align Stakeholders Early I align stakeholders before committing budget, scope, or delivery dates – not after. I start with 4 questions: Who approves? Who can block progress? Who does the work? Whose work will change? Then I turn those answers into a shared plan: Define success: Agree on measurable goals, scope limits, …
Continue reading “How B2B Leaders Align Stakeholders Early”
READ MORE
5 Ways Marketing Aligns With Business Goals
Want your marketing to directly impact your business growth? Here’s how to make it happen. Marketing that aligns with business goals drives better results, from higher ROI to improved customer retention. Misaligned efforts, however, lead to wasted resources and missed opportunities. 5 Key Ways to Align Marketing With Business Goals: Set Clear Goals and Metrics: …
Continue reading “5 Ways Marketing Aligns With Business Goals”
READ MORE
5 Tips for Choosing Content Marketing Topics
Summary: Choosing content marketing topics goes beyond the basics of defining what content you’re going to create. You need to determine why you’re creating it, who you’re doing it for, what channels you will use to promote it, and how it supports your overall content marketing strategy. Are you feeling unsure about what content to …
Continue reading “5 Tips for Choosing Content Marketing Topics”
READ MORE